
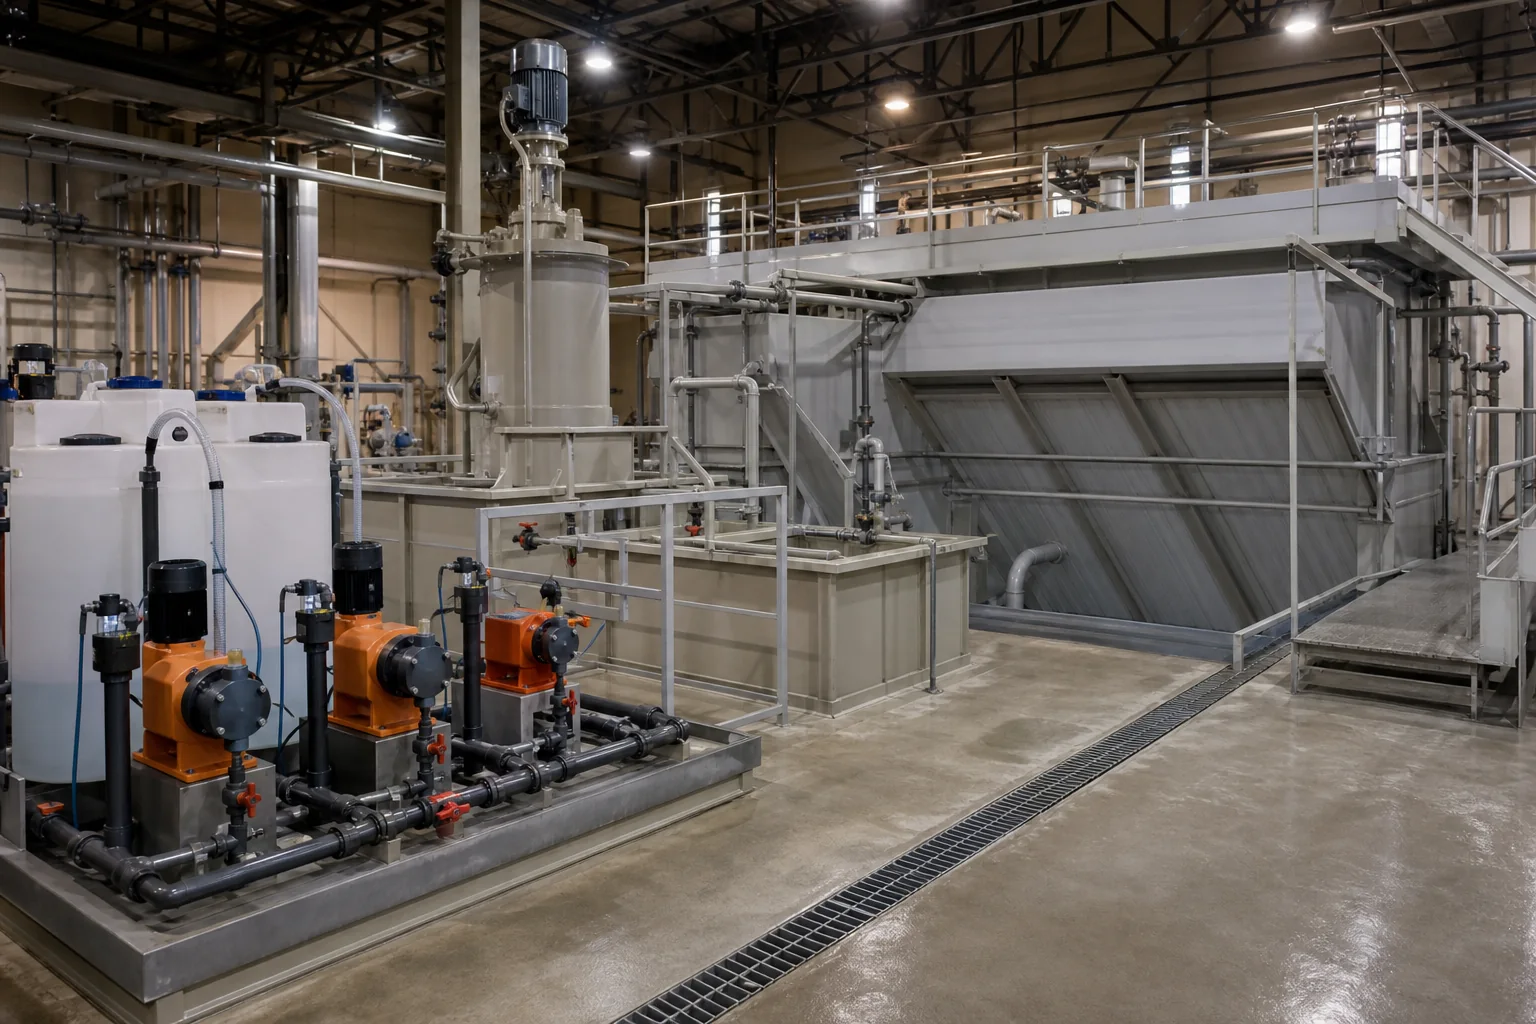
Define the operating question
State the water source, dose and pH control, target measurement and downstream separation step.
A product name alone cannot define a responsible treatment recommendation.
Characterize representative water
Record turbidity, color or target contaminant, alkalinity, pH, temperature and credible variability.
Use actual operating water rather than one convenient synthetic sample.
Normalize product and dose
Compare candidates on the same active aluminum or Al2O3 basis and document stock preparation.
Neat product units can hide differences between liquid and powder grades.
Reproduce mixing and time
Keep addition order, rapid mix, flocculation energy and settling time consistent.
A strong beaker result obtained with unrealistic mixing may not scale to the plant.
Measure the complete result
Track settled turbidity, pH, floc behavior and the application-specific analytical target.
Include sludge or filtration consequences where they control operating cost.
Release a bounded window
Link water, product code, lot, dose basis, mixing, measurements, COA, SDS and quotation.
Revalidate meaningful water, process or supplied-product changes.
Diagnose failure modes
Separate raw-water change, product identity, pump delivery, pH, rapid mixing, floc breakage and clarification loading.
Change one factor at a time when operations allow and preserve the baseline.
Close the purchasing record
State sample and trial quantity, monthly demand, packaging, destination, document needs and receiving checks.
The approved sample and production supply must remain traceable.
Turn the test into an operating band
Build dosage and pH control as a two-variable experiment. First measure raw-water pH and alkalinity, then run a practical PAC dose ladder without adjustment to observe the natural response. Around the strongest dose region, test the pH conditions the plant can actually maintain. This avoids selecting an attractive laboratory point that requires unrealistic chemical addition or control accuracy.
Record final pH for every jar, not just the prepared starting value. Track settled turbidity, color or target contaminant, floc behavior and sludge response. An underdosed jar may show weak destabilization and slow settling; an excessive dose can increase residuals, restabilize particles or create unnecessary sludge. Diagnose from the complete data pattern rather than using floc size alone.
Translate the laboratory window to feed equipment. Verify product density or solution concentration, pump stroke, calibration column results, flow signal and dilution arrangement. Express the plant setpoint on the same basis used during testing. A chemistry problem cannot be separated from a delivery problem when the actual dose is unknown.
Set an operating band with a normal target, high and low review limits, sampling frequency and defined correction sequence. Recheck water temperature, alkalinity and contaminant loading before moving the dose aggressively. Preserve the reference jar test and repeat it after raw-water shifts, product changes or feed-system maintenance. The goal is a controllable response window, not one permanent universal dosage.
Trend dose against raw-water condition and treated result rather than viewing each adjustment in isolation. A simple operating chart can show whether higher demand follows turbidity, alkalinity, temperature or a production event. Review the trend before changing the normal target. If the relationship disappears, check sampling, pump delivery and product identity before assuming that the coagulation chemistry has permanently changed.